You can reference the original documentation of OHLxG.1 here. The goal of this second version of the OHL expected goals model is to refine some of the areas undertargeted by the first model and optimize the model for consistent game-by-game updates.
Data Changes
V2 utilizes the entire sample of tracked shots in the OHL history compared to less than a full season from V1. Data is run with a train-test partition to prevent overfitting.
Distance to goal, angle to goal, time since last same side shot, distance to goal of last same side shot, and shot situation (EV, PP, SH) are all maintained consistent betwen v1 and v2.
Using the OHL shot quality variables were removed in this model as I learned they only consider shot location--something I've already accounted for in the model. One of the more unfortunate variables removed was that of shot type. Shot type used to differentiate between slap shots, tips, wrist shots etc in the previous model. These variables are inconsistently tracked and only recorded for nearly half the games skewing some of the results on an individual game basis.
The additions we'll look more closley at include change in angle, a count of recent shots, player weight and height, and rink adjustments.
Angle Change
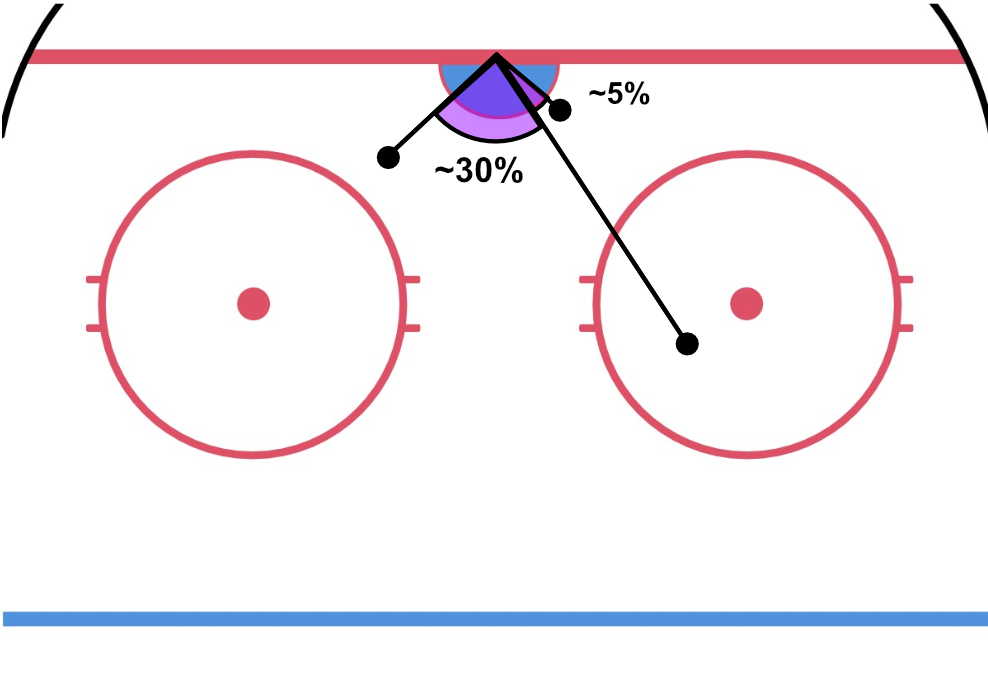
The idea of change in angle is that when considered with time since most recent shot, the change in angle from the shot in question and the previous shot can allow the model to better predict breakaway opportunities. The image displays what this variable calculates. Shots taken with a greater numbers of time since should decrease the significance of this factor. A shot that bounces directly back out to where it was shot off the rebound with no pass would result in an angle change of 0. A shot that bounces off the goalies pads or is passed cross-crease quickly after the most recent shot is demonstrated with this variable, improving the accuracy of the model. This added variable is the most import direct variable addition with it placing as the 5th most important variable in calculating xG for this xGBoost model.
Recent Shot Count
Big props to the new additions in NHL 23 for inspiring this idea. The idea behind this value is to calculate the number of shots in a certain time period to gauge a level of 'pressure' and goalie fatigue. Through trials of testing the number of shots in different quantities of seconds in multiples of 10, the variable that was most useful in the 80 second span. When grouped by the number of shots in the last 80 seconds, the 80 second span showed mean sh% that consistently increased with the number of shots--a logical indicator that there is some validity to this variable. One thing that limits the usefulness of this variable is that there aren't many samples where there are 4 or more shots in 80 seconds from a single team.
Player Bio Info
An additional consideration into this model is some of the effects on shooting and expected goals that come from player bio information. The information being referenced here, specifically, are the players' height and weight. These variables actually carried some weight in prediciting xG with weight placing slightly below average in terms of the used variables rank in significance and height being even closer to the bottom. The contributions made by height and weight factors clearly serve to refine xG calculations in given scenarios rather than ever being primary drivers.
Rink Adjustments
Maybe the most important change from the perspective of methodology is the implementation of rink adjustments.
Firstly, it's important to point out that this is a change that doesnt involve inputting new variables into the model but rather coordinate manipulation. This is not the only instance of coordinate manipulation in the model as x & y coords are shifted depending on a player's handedness. Rink adjustments have the potential to shift coordinates even more than handedness.
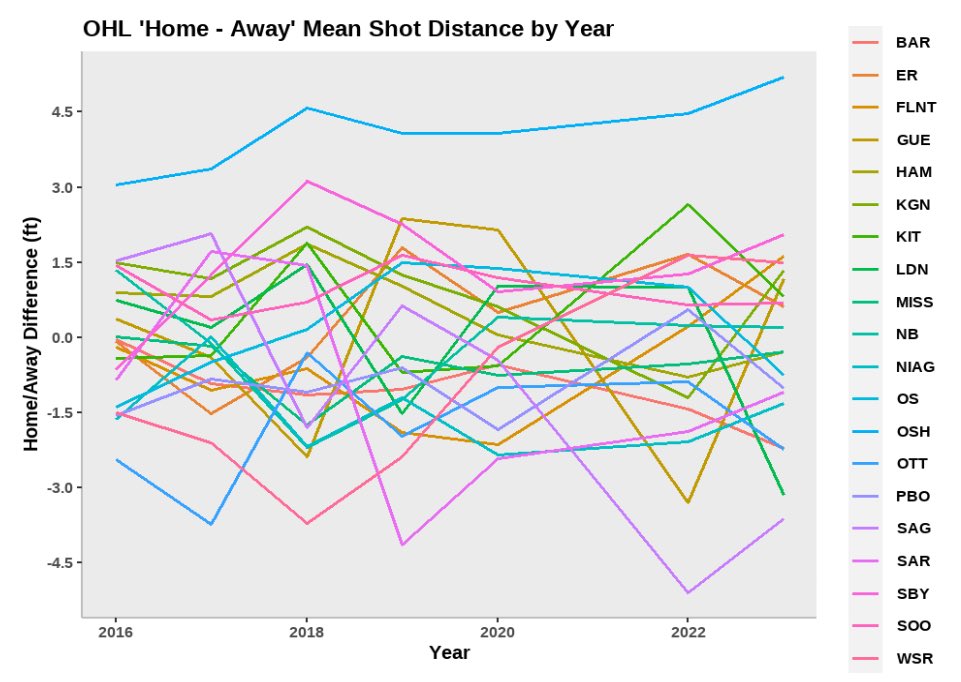
The idea behind rink adjustments is that not all shots are tracked the exact same from rink to rink. If we can discover trends that may ruin the consistency of shot tracking from rink to rink, it can superficially boost/negate player performance based on something outside of their control. The methodology works by taking the mean distances of both shots for and against at a teams home arena versus shots for and against at away arenas. Theoretically, because we're incorporating both shots for and against of all different teams,when subtracing the two they should be roughly at 0 over time.
This is where the adjustment comes in (especially for the light blue line, Oshawa at the top of that chart). Oshawa shot trackers have recorded all shots at the home arena consistently further than the away 'mix' of shot trackers suggesting clear errors in their process that are adjusted for in this model.
The Model
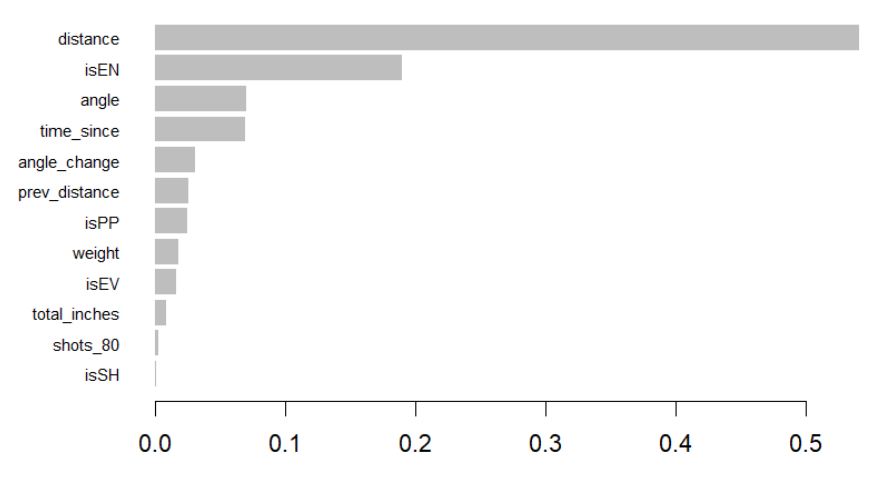
Happy to answer additional questions about the model process itself, and much of that info is included in the V1 writeup, so I'll just include the updated significance chart here!
Comparison
This model is significantly more efficient in runtime than the previous model. Additionally, the proper dataset (2016-2023) and partitoning process increase my confidence in the results.
It's not just my confidence however! Here's how the V2 results stack up to the V1, primarily differences between train and test are albeit eliminated, suggesting there is no risk of overfitting.
V1 - AUC: train = .730, test = .694
V2 - AUC: train = .741, test = .739
V1 - Log Loss: train = .326, test = .339
V2 - Log Loss: train = .311, test = .312